Table of Contents >> Show >> Hide
- Why Measuring Plant Growth Rate Matters
- Method 1: Measure Plant Height Over Time
- Method 2: Count Leaves, Nodes, or Growth Stages
- Method 3: Measure Biomass for the Most Accurate Growth Picture
- Method 4: Track Leaf Area, Canopy Growth, or Optical Readings
- Which Method Is Best?
- Common Mistakes When Measuring Plant Growth Rate
- Practical Example: A Simple Plant Growth Study
- Experience and Observations From Real-World Plant Tracking
- Conclusion
Plants are polite little overachievers. Give them light, water, nutrients, and a decent container, and they’ll get busy doing what plants do best: growing when nobody is looking. The problem is that “looks bigger than last week” is not exactly a scientific measurement. If you want to understand plant performancewhether you’re growing basil on a windowsill, tomatoes in a backyard bed, or trial crops in a greenhouseyou need a better system.
This guide explains four practical ways to measure growth rate of plants, from simple ruler-based methods to more advanced approaches using biomass, leaf area, and optical tools. The goal is not to make your garden feel like a laboratory with trust issues. It is to help you track plant growth in a way that is accurate, repeatable, and useful.
Done well, plant growth measurement can tell you whether a fertilizer plan is working, whether light levels are too low, whether stress is slowing development, and which plants are actually thriving instead of merely posing dramatically. Let’s dig into the methods that matter most.
Why Measuring Plant Growth Rate Matters
Plant growth rate is more than a curiosity. It is one of the clearest ways to evaluate plant health, growing conditions, and management decisions over time. If one tray of seedlings grows taller, develops more leaves, or produces more dry matter than another, that difference usually reflects real biological responses to temperature, light, water, nutrient availability, or genetics.
Good measurements also keep you honest. Gardeners and growers are famous for optimistic estimates. “That sunflower grew a foot overnight” sounds fun, but a notebook is less sentimental than memory. When you record measurements on a schedule, you can compare treatments, identify slowdowns early, and avoid making decisions based on vibes alone.
Before using any method, keep three rules in mind:
1. Be consistent
Measure the same plants, at the same time of day, using the same technique each time. Otherwise, your data will be as wobbly as a tomato cage in a thunderstorm.
2. Use intervals
A growth rate is a change over time. Measuring once tells you size. Measuring weekly or every few days tells you growth.
3. Match the method to the goal
If you want quick home tracking, height may be enough. If you want a serious comparison of treatments, dry biomass or leaf area may be better.
Method 1: Measure Plant Height Over Time
The simplest and most common way to measure plant growth rate is by tracking plant height. This method works especially well for upright plants such as beans, corn, peppers, sunflowers, many houseplants, and young tree seedlings.
How to do it
Measure from the base of the stem at the soil surface to the highest natural point of the plant. Do not stretch leaves upward to make the plant “sound taller on paper.” Plants are not trying out for a basketball league.
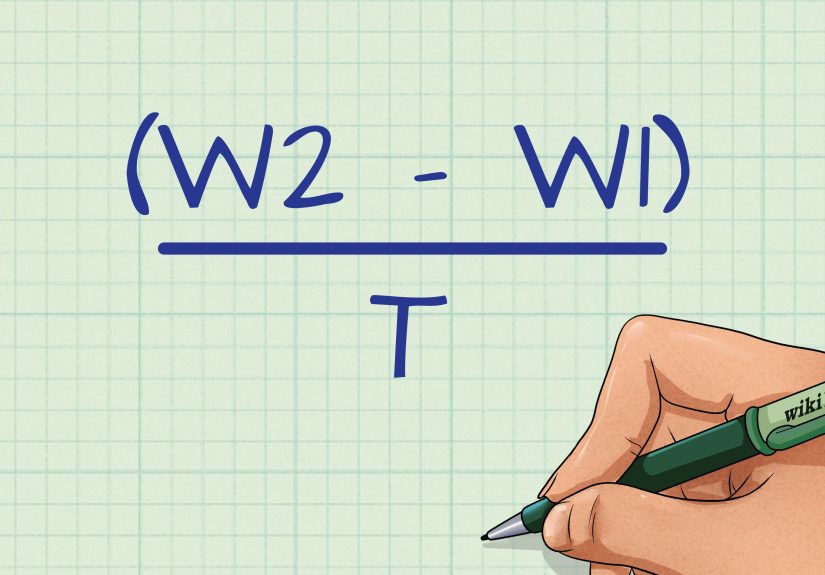
Record the height in inches or centimeters at regular intervals. Then calculate growth rate with this simple formula:
Growth rate = (Final height − Initial height) ÷ Number of days
Example: If a bean seedling grows from 8 cm to 20 cm in 6 days, its average height growth rate is 2 cm per day.
Best uses
- Seedling experiments
- Comparing fertilizer or light treatments
- Tracking stem elongation
- Monitoring greenhouse transplants
Pros
- Easy and inexpensive
- No special equipment required
- Great for classrooms, home gardens, and quick field checks
Limitations
- Taller does not always mean healthier
- Low light can cause stretched, weak stems
- Bushy or trailing plants may not be represented well by height alone
That last point matters. A leggy seedling can look impressively tall while actually underperforming. Height is useful, but it should be interpreted alongside other signs such as leaf color, leaf number, stem thickness, and overall vigor.
Method 2: Count Leaves, Nodes, or Growth Stages
Not all growth shows up as extra height. Some plants stay compact while producing more leaves, branches, or developmental stages. That is why counting leaves, visible nodes, or recognized vegetative stages is another smart way to measure plant growth rate.
How to do it
Select a clear, repeatable counting rule. For example:
- Count fully expanded leaves only
- Count visible nodes on the main stem
- Use a crop-specific staging system, such as vegetative stages in corn
Then track how many new leaves or stages appear over time.
Leaf production rate = (Final leaf count − Initial leaf count) ÷ Number of days
Example: If a pepper plant goes from 6 fully expanded leaves to 14 in 8 days, the leaf production rate is 1 leaf per day.
Why this works
Leaf and node counts are especially helpful because they reflect development, not just size. A plant may not get dramatically taller in one week, but if it adds several healthy leaves, it is still progressing. In many crops, growth stage tracking is a reliable way to assess vigor and time management decisions.
Best uses
- Compact plants like lettuce, basil, and many ornamentals
- Crops with established stage systems
- Situations where height is misleading
Pros
- Simple and low cost
- Good for developmental tracking
- Useful when plants branch heavily or stay low
Limitations
- Old leaves may drop, complicating counts
- Different observers may count differently unless rules are strict
- Leaf size is not captured, only number
If you use this method, define your rules before you start. “Count leaves that look leaf-ish” is not a protocol. “Count leaves at least 50% expanded” is much better.
Method 3: Measure Biomass for the Most Accurate Growth Picture
If you want the gold standard for measuring plant growth rate, use biomass. Biomass tells you how much plant material has actually been produced. Unlike height, biomass is much harder for a plant to fake.
There are two common versions: fresh weight and dry weight. Fresh weight is quick, but dry weight is more reliable because it removes water differences. A plant watered five minutes ago can seem “heavier” without truly having grown much. Dry weight fixes that problem.
How to do it
Harvest the plant or clipped plant material, depending on your study. For dry biomass:
- Collect the plant sample
- Dry it in a drying oven or food dehydrator set appropriately for plant tissue
- Continue drying until weight is stable
- Weigh the dry sample on an accurate scale
Biomass growth rate = (Final dry weight − Initial dry weight) ÷ Number of days
For researchers and serious growers, relative growth rate can also be calculated based on biomass over time. That allows more refined comparisons between plants that start at different sizes.
Best uses
- Experiments comparing fertilizer, irrigation, or temperature
- Forage, cover crop, and field biomass assessment
- Research projects where accuracy matters most
Pros
- Very accurate indicator of real growth
- Excellent for comparing treatments
- Useful for nutrient uptake calculations
Limitations
- Usually destructive
- More labor-intensive
- Requires drying and weighing equipment
For home growers, biomass can still be practical in small trials. Suppose you grow radish microgreens under two light setups. Harvest a sample from each tray, dry the material, and compare dry mass. Suddenly your kitchen experiment becomes surprisingly respectable.
Method 4: Track Leaf Area, Canopy Growth, or Optical Readings
Sometimes the best way to measure plant growth is by looking at the plant’s photosynthetic machineryits leaves. Leaf area, canopy coverage, chlorophyll readings, and vegetation indexes such as NDVI can reveal how much productive surface a plant is building and how actively that canopy is functioning.
Option A: Leaf area or canopy area
Leaf area can be estimated with imaging software, smartphone photos against a reference grid, leaf area meters, or canopy analysis tools. In larger plantings, leaf area index, or LAI, estimates how much leaf surface exists over a given ground area.
This method is especially valuable because leaf area often relates closely to biomass accumulation and light capture. In simple terms, more healthy leaf surface usually means more capacity for photosynthesis and growth.
Option B: Chlorophyll meters
Handheld chlorophyll meters such as SPAD-type devices estimate leaf greenness by measuring light transmission through the leaf. These readings do not directly measure size, but they can help explain growth performance by showing changes in chlorophyll status and likely nitrogen sufficiency.
Option C: NDVI and remote sensing
NDVI, short for Normalized Difference Vegetation Index, uses red and near-infrared reflectance to estimate crop vigor. Handheld sensors, drones, and imaging systems can all be used. NDVI is particularly useful for monitoring larger groups of plants where measuring each one individually would take forever and possibly your patience.
Best uses
- Greenhouse crops
- Field trials and row crops
- Comparing canopy development
- Detecting stress before it becomes obvious by eye
Pros
- Can be non-destructive
- Great for repeated measurements
- Helpful for larger plantings and advanced monitoring
Limitations
- Equipment can be expensive
- Data must be interpreted carefully
- Optical readings estimate vigor, not direct dry matter by themselves
For many growers, a practical compromise is to combine leaf area or canopy photos with height and leaf counts. That gives a more complete picture without requiring a drone budget or a graduate assistant.
Which Method Is Best?
The best method depends on your purpose.
For home gardeners
Use height plus leaf count. It is easy, free, and much better than guessing.
For school projects
Use height measurements, leaf counts, and photo documentation. Add simple growth-rate calculations for a stronger project.
For greenhouse growers
Use height, leaf area or canopy images, and chlorophyll readings when available.
For researchers or serious trials
Use dry biomass, relative growth rate calculations, and optical tools for repeated non-destructive monitoring.
In real life, the strongest approach is often a combination. Height tells you one story. Biomass tells another. Leaf area and chlorophyll readings fill in the rest. Plants are complex organisms, so one number rarely tells the whole truth.
Common Mistakes When Measuring Plant Growth Rate
- Measuring at random times instead of on a schedule
- Changing the measurement method halfway through
- Comparing plants of very different ages or starting sizes without noting that difference
- Using only height for plants that grow outward more than upward
- Ignoring light, water, or temperature differences between treatments
Another frequent mistake is recording only the final result. Growth is a process, not a single dramatic reveal. A few regular measurements are far more informative than one heroic measurement taken after you suddenly remember the experiment exists.
Practical Example: A Simple Plant Growth Study
Imagine you are testing whether two light setups affect basil growth. You grow 10 plants under a sunny window and 10 under a grow light. Over 21 days, you measure height every three days, count fully expanded leaves weekly, and photograph canopy area from above. At the end, you harvest three representative plants from each group for dry-weight biomass.
That setup gives you four layers of information:
- Height increase shows vertical growth
- Leaf count shows developmental progress
- Canopy photos show how full the plants became
- Dry biomass shows which group produced more real plant material
If the window plants are taller but the grow-light plants have greater dry biomass and denser canopies, you have learned something important: the taller plants were likely stretching for light, while the grow-light plants were building more useful tissue.
Experience and Observations From Real-World Plant Tracking
One of the most interesting things about measuring plant growth rate is how quickly it changes the way you look at plants. Before tracking data, many growers assume the “best-looking” plant is the one that is growing fastest. After a few careful measurements, that confidence starts to wobble. The tallest plant is not always the most productive. The darkest green plant is not always the one adding the most biomass. The compact little seedling that seems unimpressive on day five may quietly become the strongest performer by day twenty.
That pattern shows up constantly in home gardens and simple experiments. Seedlings grown in dim indoor light often shoot upward dramatically. At first, they look like the winners. Then you count leaves, compare stem strength, and eventually weigh dry matter. Suddenly the champion turns out to be a spindly drama queen with a weak stem and very little substance. Measuring growth rate teaches humilityboth for the grower and, in a poetic sense, for the plant.
Another common experience is realizing how much environment changes daily growth. A few cloudy days can slow progress. A stretch of warm, bright weather can make plants seem to leap forward. Consistent measurement helps separate real trends from temporary mood swings caused by weather. This is especially useful with herbs, lettuce, beans, and seedlings, which can respond quickly to improved light or moisture.
Growers also learn that averages matter. A single plant can be weird. In fact, many plants appear to view “uniformity” as an optional lifestyle choice. One seedling may lag behind because of seed quality. Another may explode with growth because it got slightly better root contact or more light from the edge of the tray. Measuring several plants and averaging the results gives a much clearer picture than obsessing over one botanical overachiever.
There is also a practical satisfaction in combining simple methods. A ruler, a notebook, and regular photos can reveal a surprising amount. Add occasional leaf counts and end-of-trial biomass, and even a modest home experiment begins to produce meaningful conclusions. Gardeners who start measuring often become better growers because the process forces them to notice patterns: when plants stretch, when leaves pale, when growth stalls, and when a change in care actually helps.
Perhaps the biggest lesson is that plant growth is not one-dimensional. Height, leaf number, canopy coverage, and dry matter each capture a different side of the story. The more thoughtfully you measure, the more clearly you understand what your plants are really doing. And once you start seeing growth that way, it is hard to go back to “Yep, looks bigger.”
Conclusion
If you want to measure growth rate of plants accurately, four methods stand out: plant height, leaf or stage counts, biomass, and leaf-area or optical measurements. Each one serves a different purpose. Height is quick and accessible. Leaf counts capture development. Biomass is the most direct measure of real production. Leaf area, chlorophyll, and NDVI tools add a more advanced view of canopy performance and plant vigor.
The smartest approach is to choose the method that fits your goal and, when possible, combine two or more methods for a fuller picture. Plants may be quiet, but they are not mysterious once you start measuring them well.